Here’s The Top Ten Busiest Airline Routes In The World
Here’s The Top Ten Busiest Airline Routes In The World
The Official Airline Guide (OAG) released its yearly list of busiest routes in 2019. The list examines the busiest domestic and international routes, as measured by available seats. The report also details the most competitive, the longest, and the shortest routes. All categories measure two separate categories: domestic and international. It’s important to take note that these are pre-coronavirus impacts and reflect 2019 numbers.
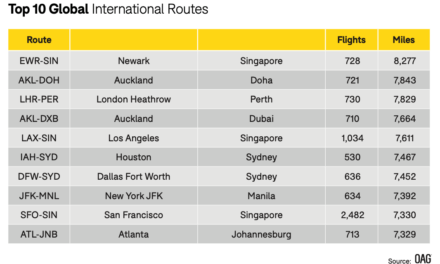
Overall, the Asia Pacific region has 9 out of 10 of the busiest routes in the world. The only United States destination that made the busiest routes list was New York JFK to London Heathrow. Meanwhile, 10 out of 10 of the most competitive routes are in the Asia Pacific region. Hong Kong is clearly a major hub for Asia, as it is at either end of 6 out of the 10 international routes.
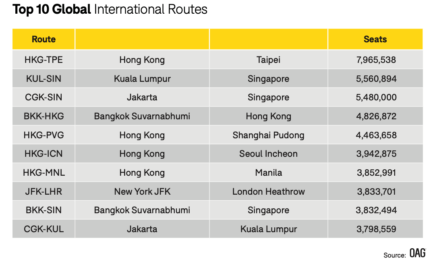
For longest domestic routes, the U.S. takes many of the top spots. Keep in mind, OAG measures longest by nautical miles, not flight time. The U.S. takes 6 out of the 10 ranking for longest domestic routes, with Boston to Honolulu being labeled the longest domestic flight in the world at 4,418 nautical miles (reminder: 1 nautical mile = ~1.151 miles).
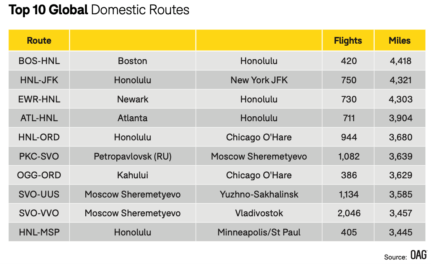
The United States takes 7 out of the 10 spots for the longest international routes. Newark to Singapore is the number one longest route in the world, coming in at 8,277 nautical miles.
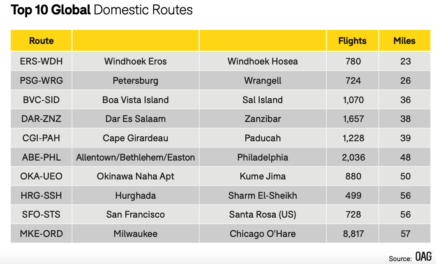
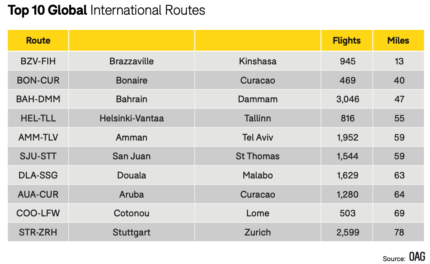
The shortest domestic route in the world is Windhoek Eros to Windhoek Hosea in Namibia, which is a 23 mile journey. Meanwhile, the shortest international route in the world is Brazzaville to Kinshasa in the Republic of the Congo. That route comes in at a whopping 13 miles.
This Will Likely Change In 2020
Of course, it will be interesting to compare these results to 2020. The impacts to flights from the coronavirus pandemic will likely change the results significantly. The world’s airlines have seen available seats decimated. In fact, Southwest Airlines became the largest airline in the world, as measured by available seats, due to the cuts in seats.
In particular, the Asia Pacific was impacted significantly after the World Health Organization was made aware of the virus in China in January. That led to a strong decrease in traffic, which has only been exacerbated by the outbreak around the world.
Bottom Line
This might give us a good year-over-year comparison of impacts to routes next year when this report is released. There has been great discussion on the impacts to airlines, including quarter one earnings reports for U.S. airlines. But I think this sort of data will serve to show both the shorter and longer terms impacts. By examining the routes and how they changed, it may be a good data point to see the impacts in available seats during the year of coronavirus.
